

Marketing produces more data than any other function and gets the least credit for it, because the numbers live in six platforms that do not talk to each other. Butterflai syncs them into one governed layer, ties them to actual revenue, and answers in plain language.
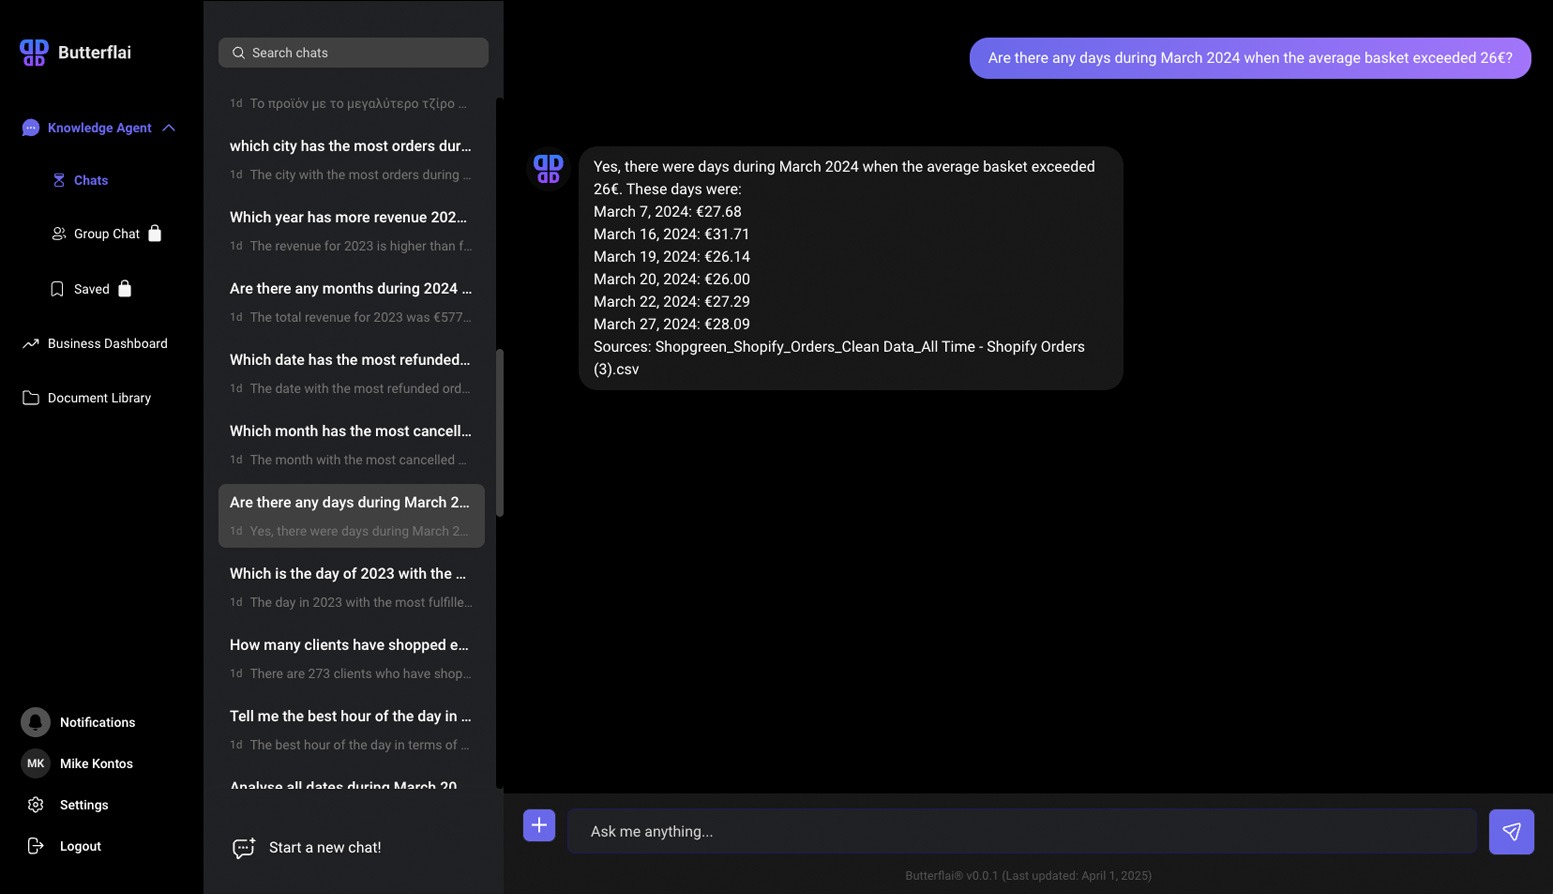
What you can ask
- “Compare campaign performance across Meta, Google Ads, and TikTok this month.”
- “Which channel brought the most revenue relative to spend?”
- “How did our email campaigns perform in Klaviyo, and how does that trend look?”
- “What are our top landing pages and conversion paths in GA4?”
- “Which search queries are growing in Search Console?”
- “How are store sales reacting to this month’s campaigns?”
Why it beats platform dashboards
- Cross-platform by default: Meta, Google Ads, TikTok, Klaviyo, GA4, Search Console, and Google Business Profile land in one analytics layer next to Shopify and WooCommerce revenue, so “what worked” is one question, not seven tabs.
- Numbers that match the platforms: syncs respect each platform’s own reporting periods and semantics, so the figures agree with what the native dashboards show.
- KPIs where the team looks: pinned dashboard widgets with rolling windows and period comparisons, on web and mobile.
- Shareable answers: bring the founder or the agency into a group room and let them see the same answer with the same sources.
Full list of sources on the Connectors page. Get a demo with your own ad accounts connected.